Open the CRT chart
Select a Deriv volatility index and watch the 4H range, FVG zones, and M15 signal markers.
www.syntheticshub.com
Learn 4-hour Candle Range Theory and use the free Synthetics Hub CRT indicator to study structured setup signals across Deriv volatility, Boom, and Crash indices.
Create a free trading account first, then return here to use the CRT chart signals and learn the Synthetics Pro model.
Start free
Synthetics Hub is built to let traders learn first. The free CRT chart gives volatility-index signals and visual structure so visitors can practice the model, journal results, and understand the opportunity before upgrading to the paid EA or mentorship.
Select a Deriv volatility index and watch the 4H range, FVG zones, and M15 signal markers.
Look for displacement, retracement into imbalance, liquidity sweep, and close back inside the range.
Record entries, emotions, FOMO, risk behavior, win rate, and what you learned from each setup.
Synthetics Pro Scanner is the premium MT5 version with automated scanning, alerts, and an 80%+ model-tested win-rate claim on synthetic indices.
Open a free Deriv account, choose synthetic indices in MT5, then use this website to study CRT signals before buying anything.
Trading involves risk. Free signals and EA performance references are educational and based on model testing, not guaranteed future results.
How Synthetics Pro Scanner works
Synthetics Pro Scanner is positioned as a signal-first MT5 scanner. It does not simply react to any candle: it waits for the bigger 4H story, then uses the 15M chart for the final execution clue.
A strong bullish or bearish 4-hour candle shows the bigger market direction.
The displacement leaves an imbalance that becomes the retracement zone of interest.
Price retraces against the main move and comes back toward the 4H fair value gap.
The lower timeframe performs turtle soup into the same imbalance area.
The 15M candle closes back within the previous 4H range to confirm continuation.
The EA sends direction, entry idea, stop loss beyond the sweep, and target structure.
Candle Range Theory basics
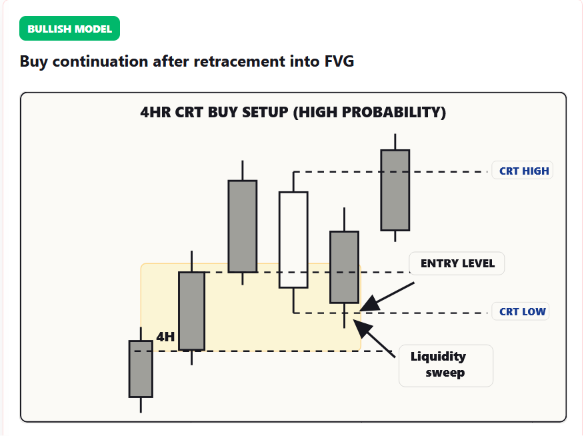
The main idea is to trade market continuation, not random reversals. When the market has made a strong bullish move and leaves a fair value gap, the next 4-hour candle may retrace back into that gap. If price sweeps liquidity into the gap and then closes back into the range, the EA looks for continuation in the original bullish direction.
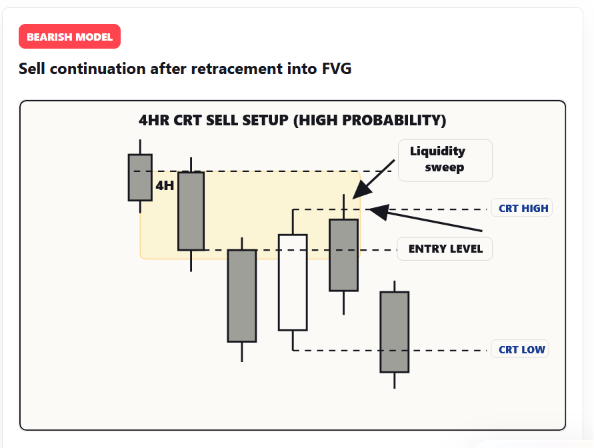
The bearish setup is the same idea in reverse: a strong bearish move creates an FVG, price retraces upward into the imbalance, sweeps liquidity, and then rejects back toward the bearish continuation.
Strategy drawings
The drawings below show the same logic in both directions: a strong 4H displacement creates a fair value gap, price retraces into the imbalance, liquidity is swept, then the 15M confirmation is used for continuation.
Featured product
Synthetics Pro Scanner is the Synthetics Hub signal scanner for MT5. It watches Deriv synthetic indices for 4H CRT/FVG setups and 15M turtle soup confirmations. It is the premium upgrade from the free CRT chart, built for traders who want more accurate scans across Market Watch symbols, MT5 alerts, and a deeper signal workflow.
Product focus
Synthetics Pro Scanner focuses on Deriv synthetic index conditions where the bigger 4H candle has already shown displacement. The lower timeframe is used only after liquidity has been swept and price closes back into the range.
Payment is confirmed manually before EA access is released.
Receives MT5 popup alerts, Experts log messages, and optional push notifications instead of forcing automatic trades.
Uses H4 for the main range and fair value gap, then M15 for liquidity sweep and confirmation.
Can scan Deriv synthetic indices added in MT5 or exact symbols such as Volatility, Boom, Crash, Step, Range, DEX, and Drift indices.
Can scan during the first hour of each new 4H candle in East African Time.
Stop loss is beyond the 15M swing, and the default take profit is set around 1:3 reward-to-risk.
The guide explains installation, symbol selection, signal locations, MT5 settings, and EA input parameters.
Synthetics Pro Scanner pricing
A simple checkout path for traders ready to move from the free CRT chart into the premium MT5 scanner.
$400 normal price after the discount period.
Free signal tool
This custom Synthetics Hub chart focuses on Deriv volatility, Boom 1000, and Crash 1000 indices. It loads Deriv candle data, draws the market structure, highlights the previous 4H candle range, and marks fair value gap zones that can be used for Synthetics Pro Scanner-style analysis. It gives visitors a free way to study the model, follow structured signals, and decide whether the premium EA or mentorship fits them.
How to read it
Use the red 4H high and low, the FVG zones, and the closed-candle return into range to read continuation signals. Synthetics Pro Scanner applies the same model inside MT5 with more accurate scans across all symbols added to Market Watch, with alerts sent from MT5.
Free CRT learning hub
Synthetics Hub teaches the 4H Candle Range Theory model for Deriv synthetic indices. Visitors can study displacement, fair value gaps, liquidity sweeps, and full candle closes back inside the range while using the free CRT indicator on this website.
The free chart helps beginners filter market noise and follow structured signal logic across multiple volatility, Boom, and Crash indices before upgrading to the premium Synthetics Pro Scanner workflow.
Follow structured setup alerts and chart context instead of guessing entries.
Learn how displacement, FVGs, liquidity sweeps, and range closes work together.
Focus on clean volatility-index conditions and avoid random market chasing.
Signal case studies
These chart examples show the Synthetics Hub workflow in a simple way: first identify the 4H CRT range and liquidity sweep, then move down to the 5-minute or 15-minute chart for the execution candle, stop-loss logic, and target. This is the same thinking the free CRT chart teaches before traders upgrade to Synthetics Pro Scanner.
Use the examples below to connect what the 4H candle is doing with the entry signal that appears on M5/M15 after price closes back inside the range.
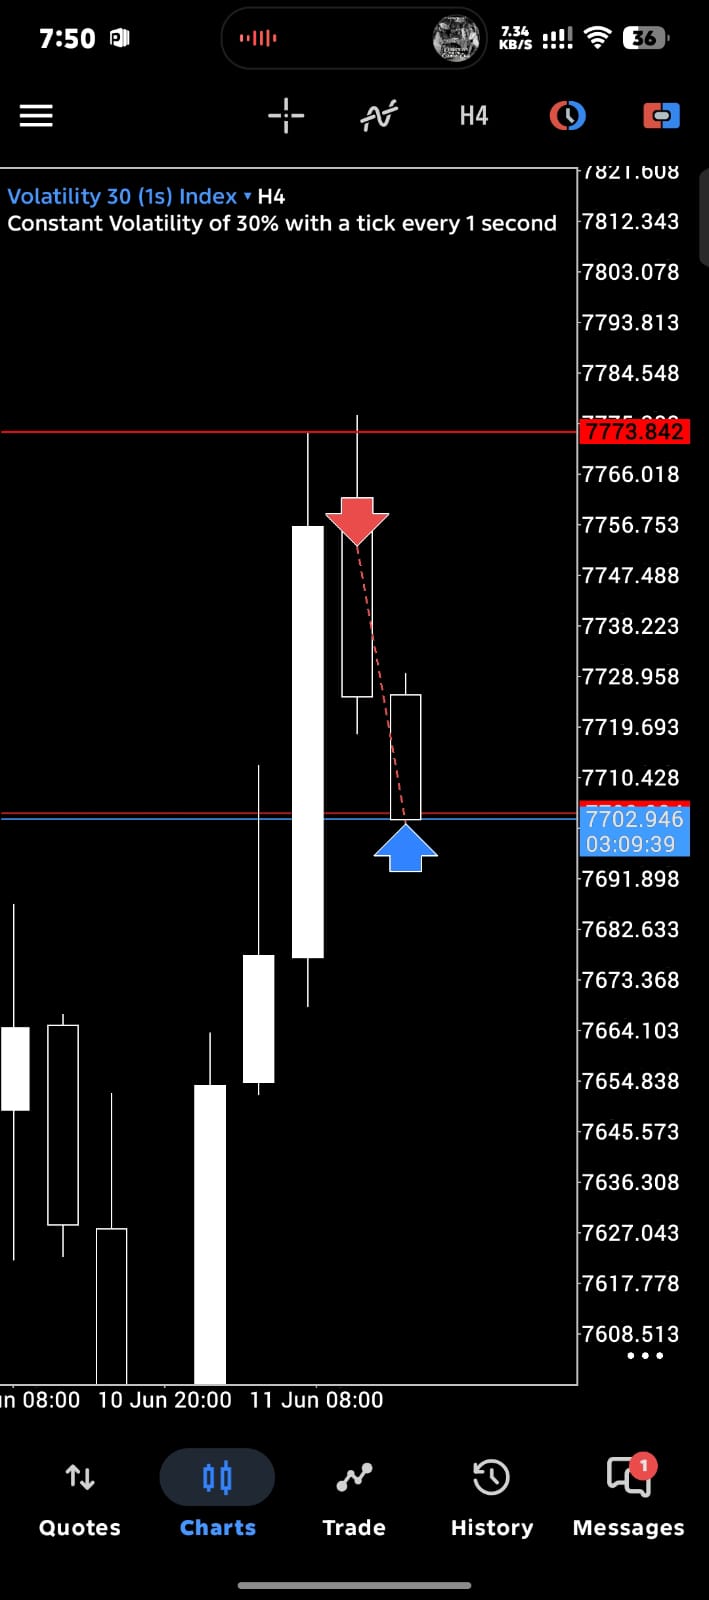
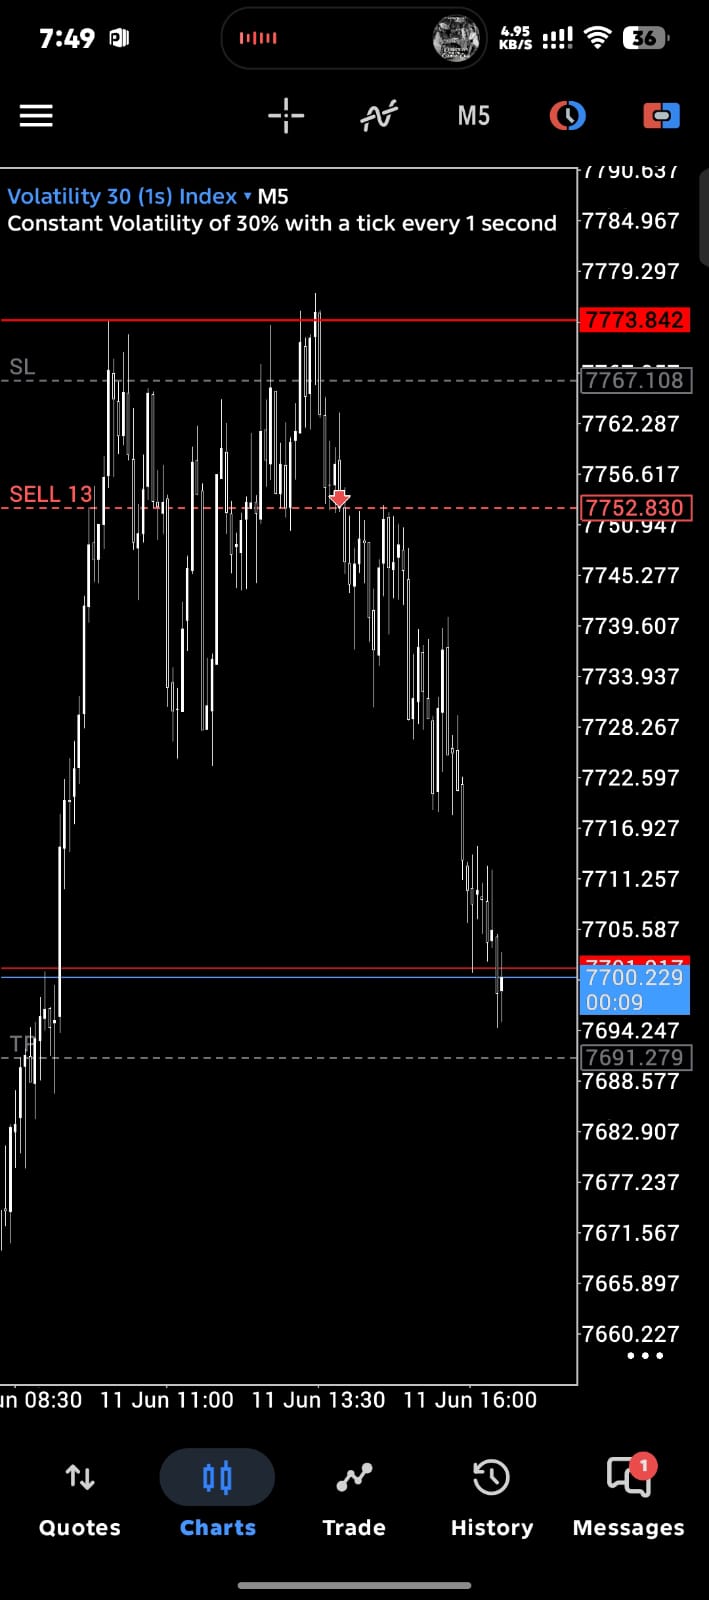
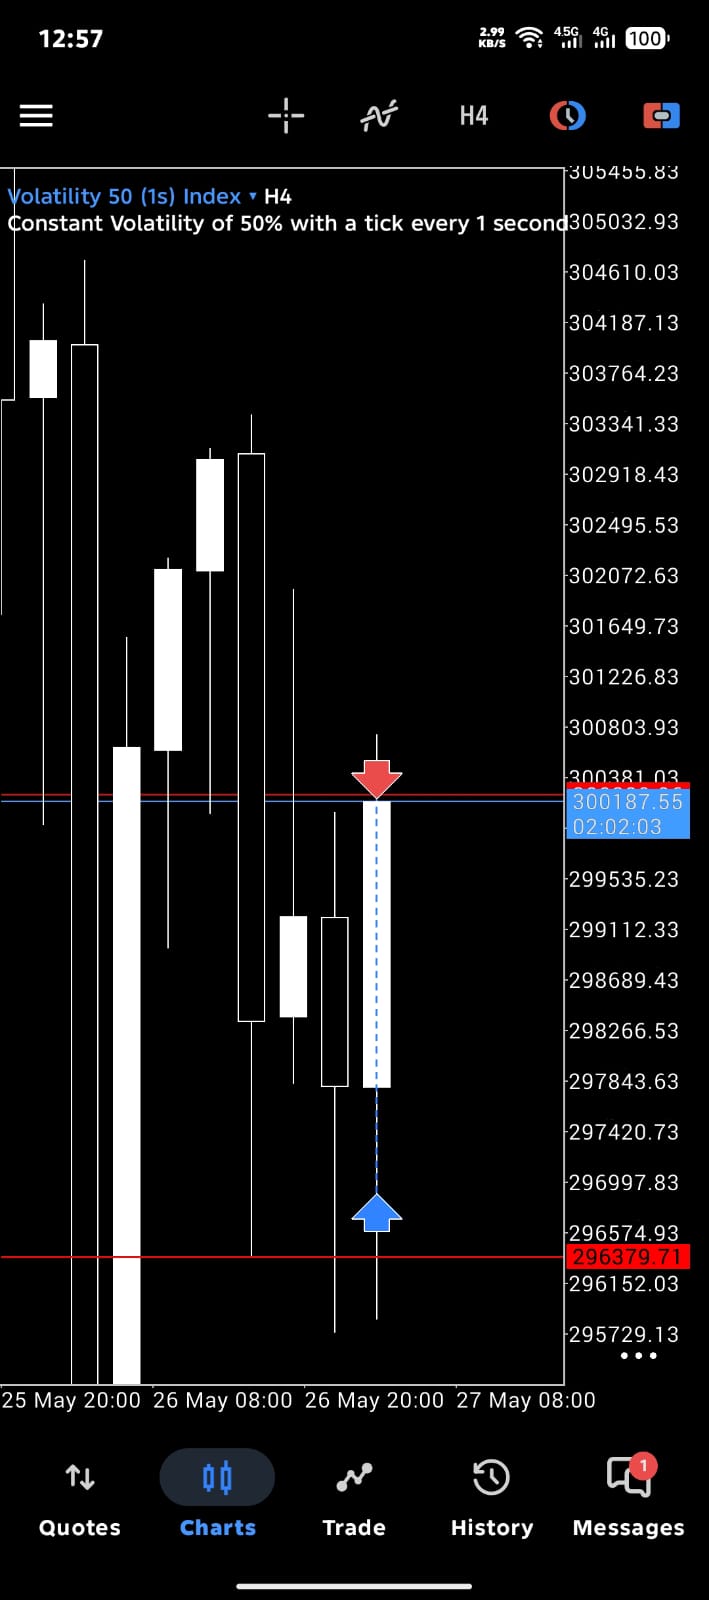
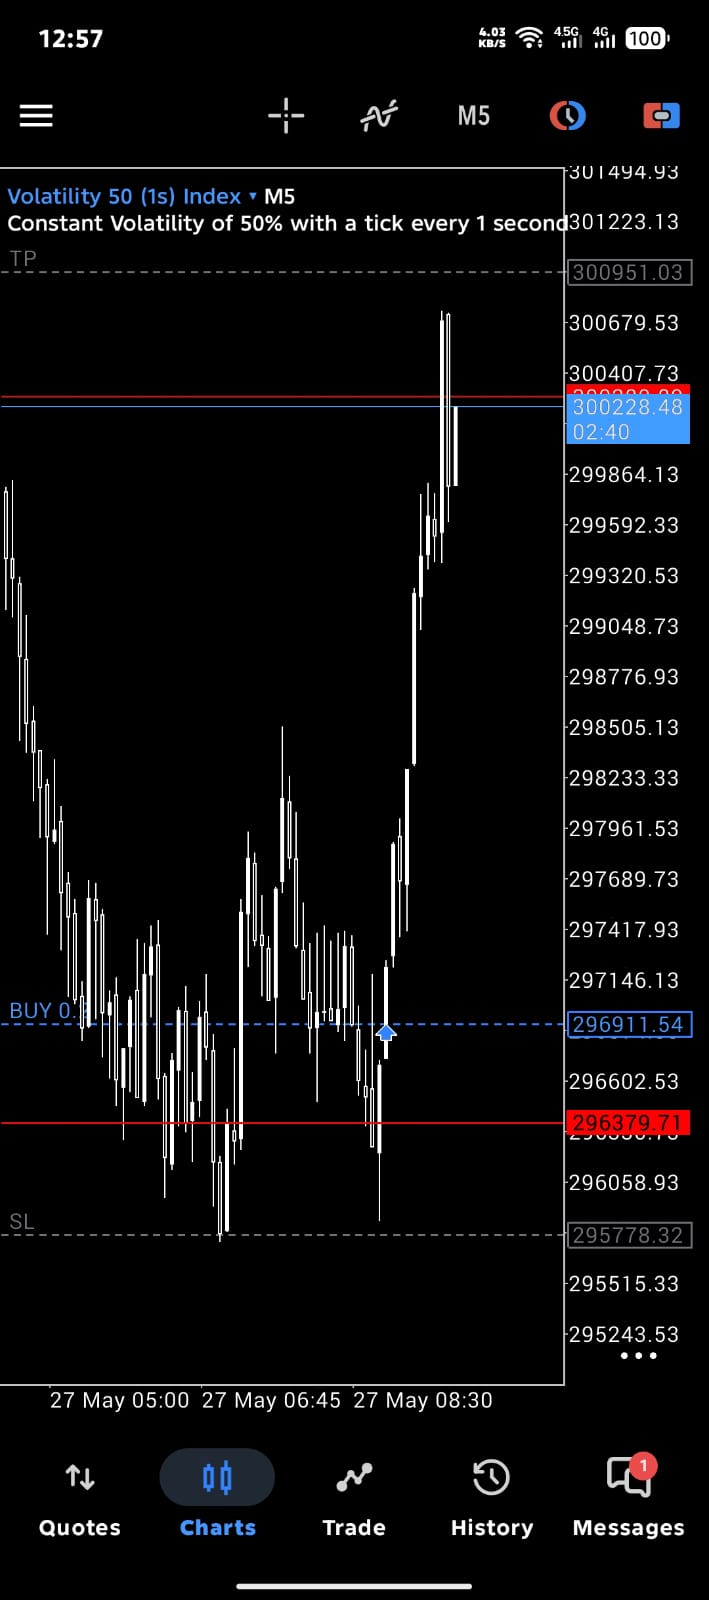
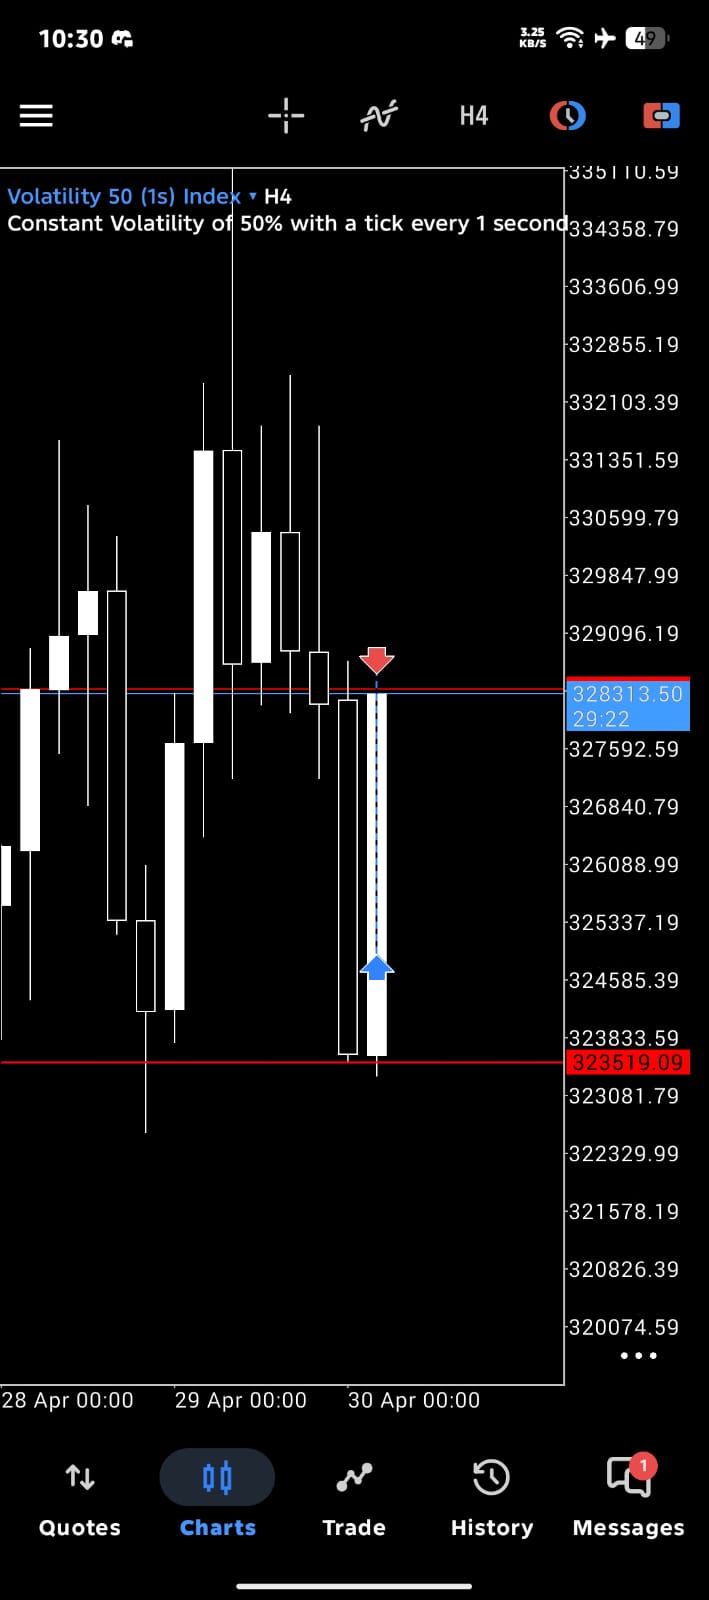
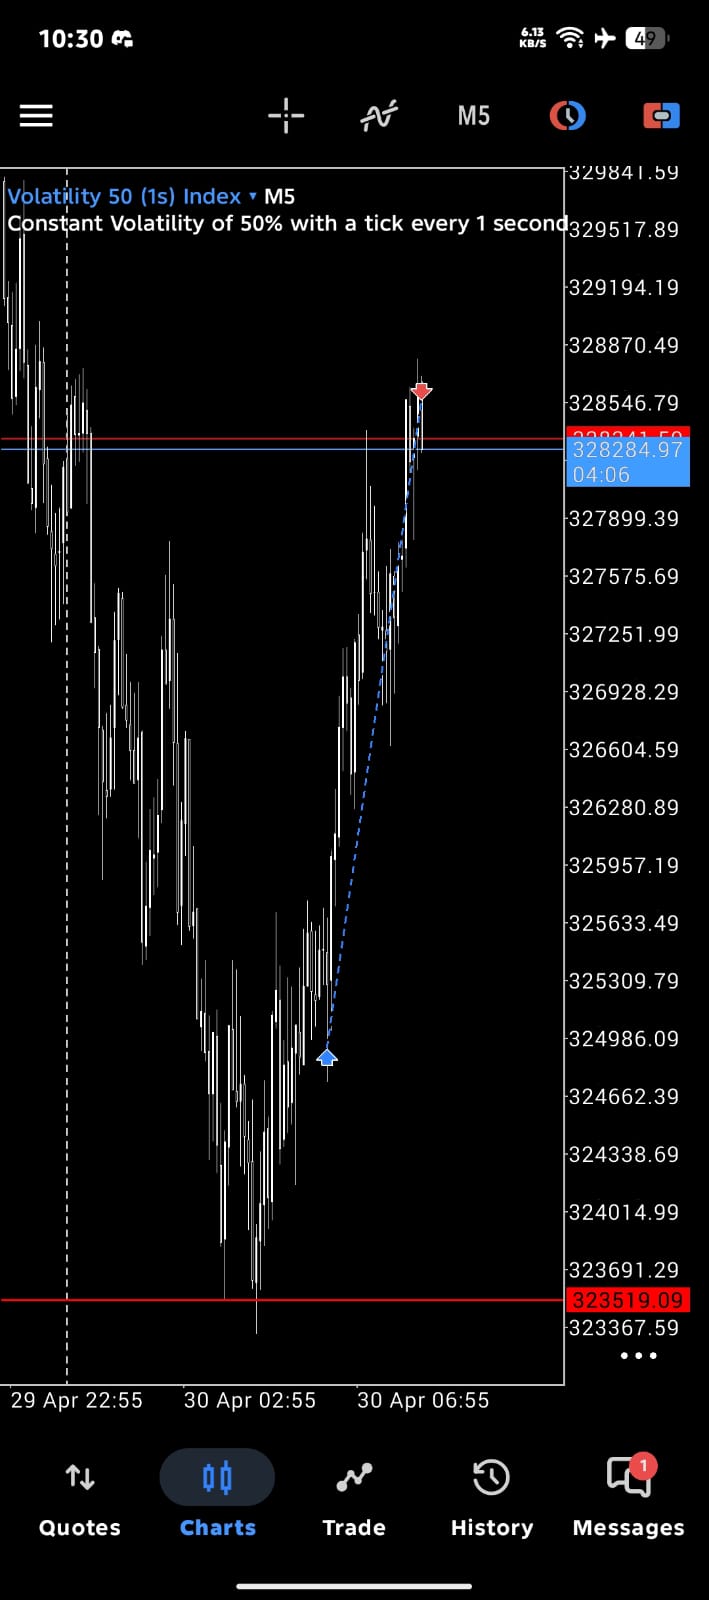
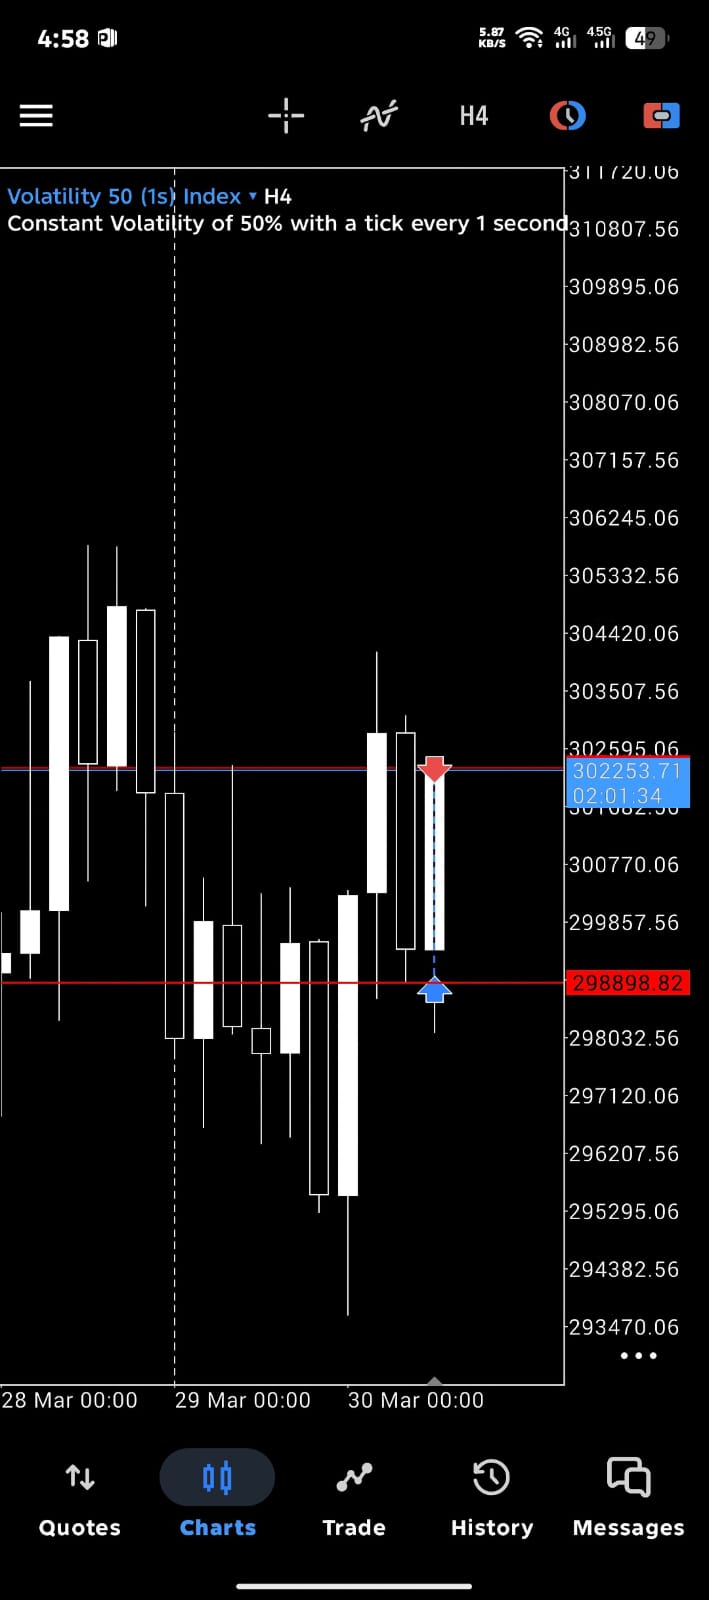
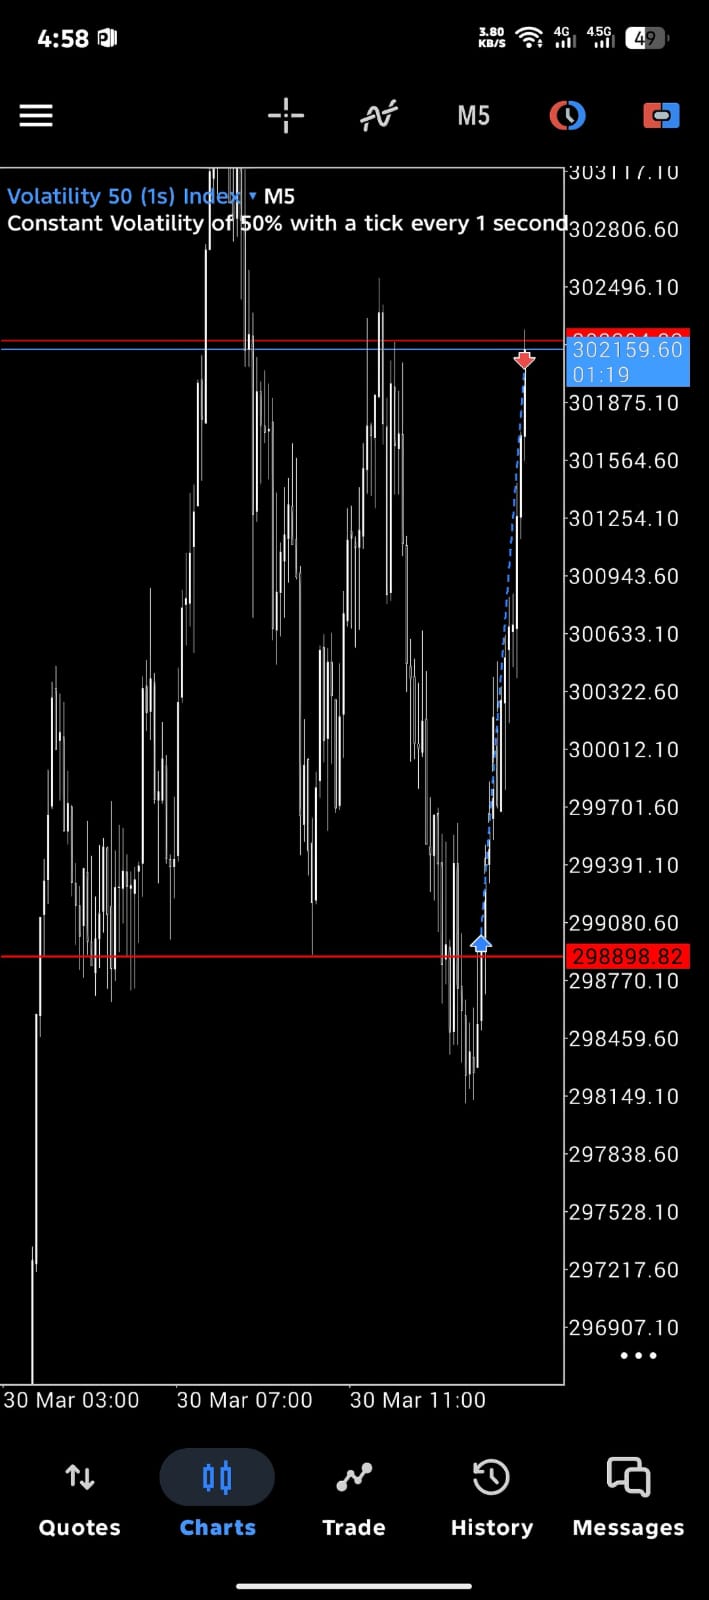
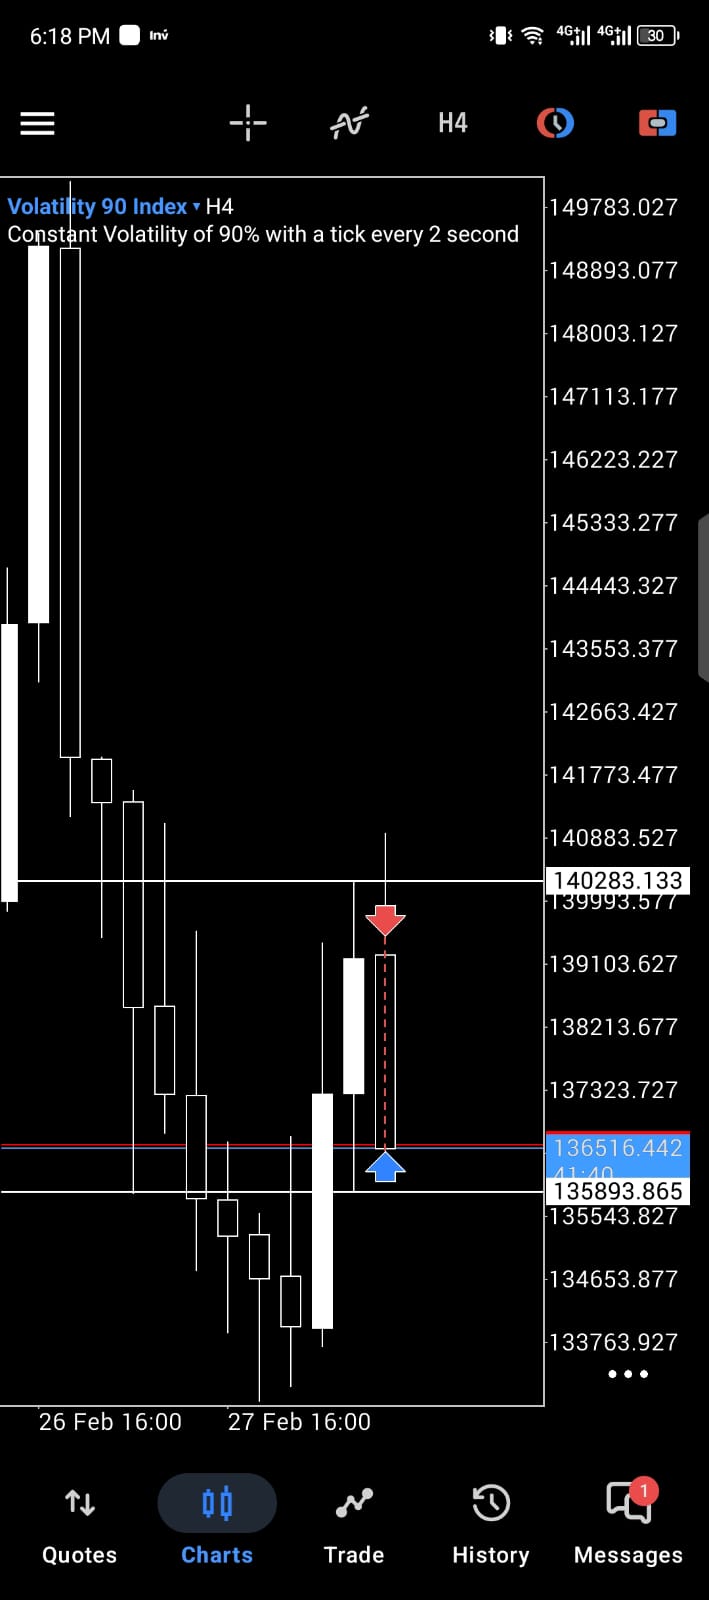
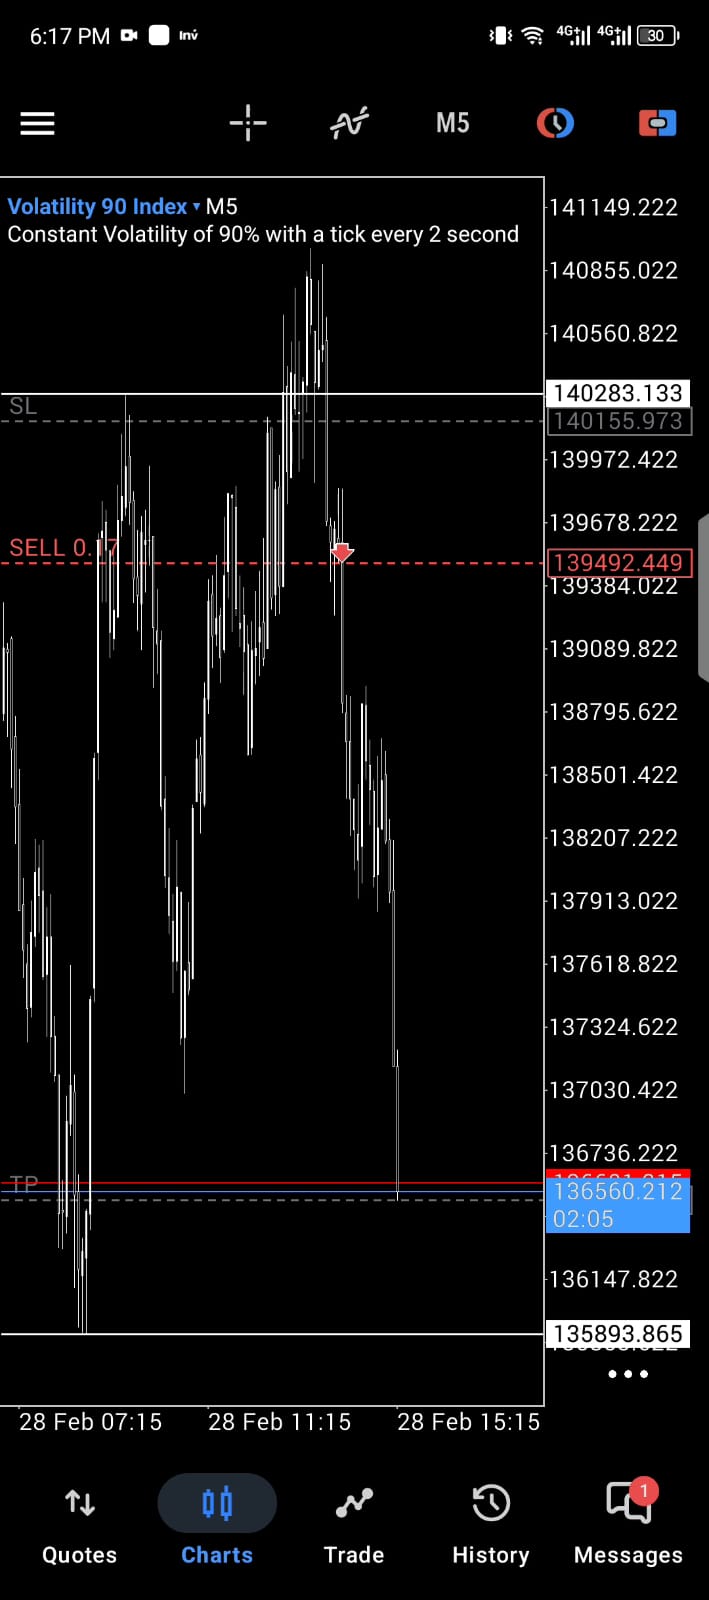
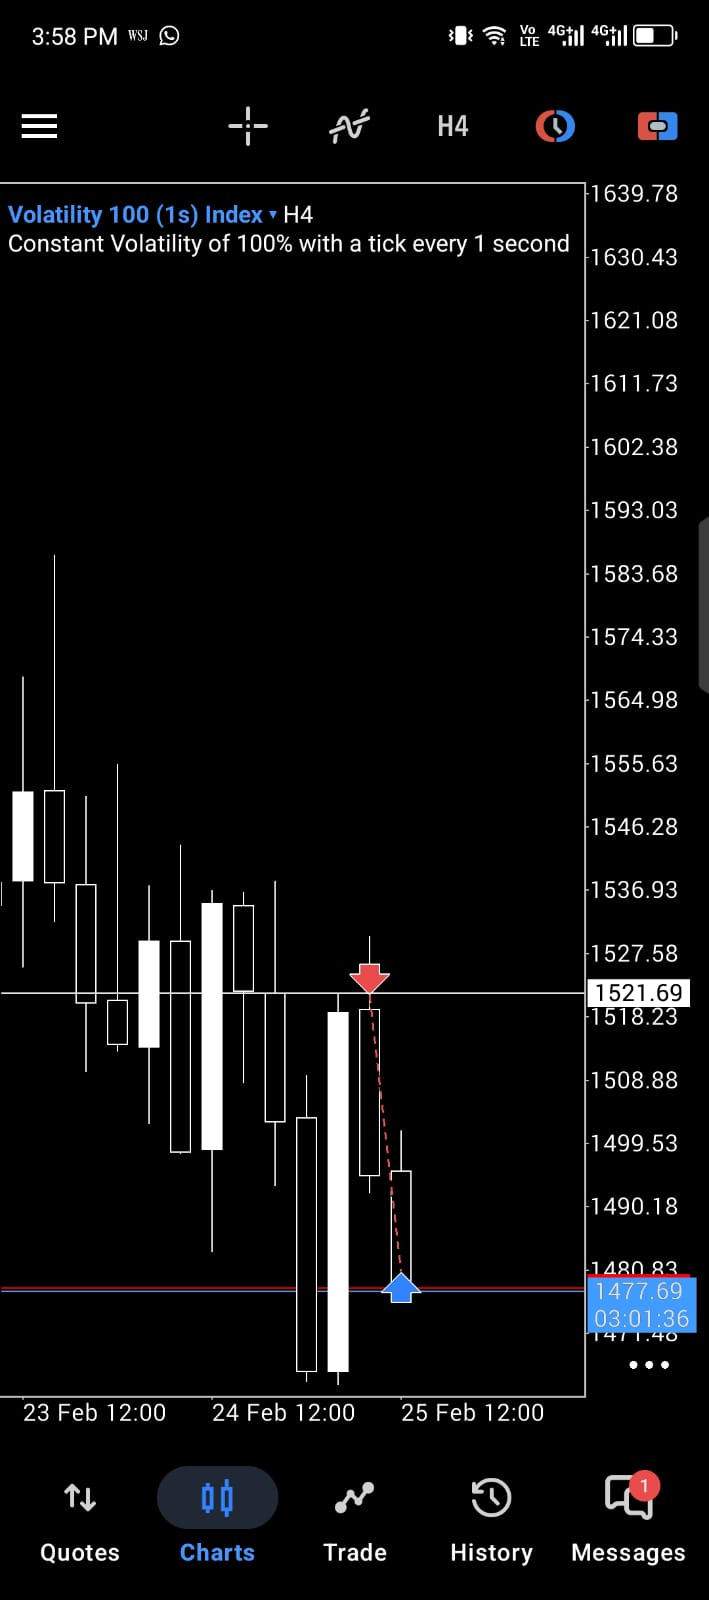
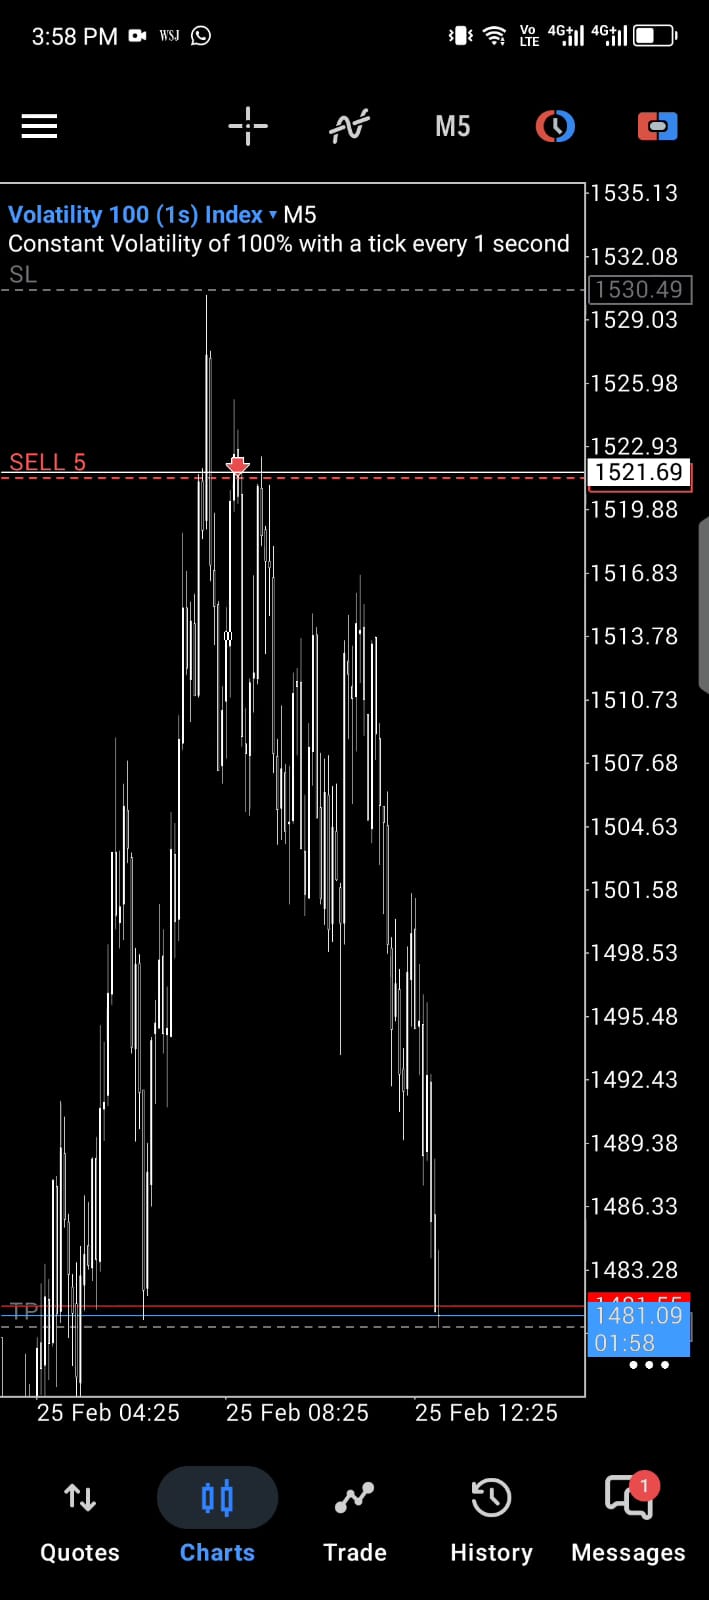
These screenshots are educational examples of Synthetics Pro Scanner-style signal logic and historical chart outcomes. They are not a promise of future profit. Every trader should manage risk and confirm conditions before acting.
Client testimonials
Manually checked feedback from EA buyers, mentorship students, and free CRT chart users.
Verified buyer
"Synthetics Pro Scanner helped me stop forcing entries. It has been easier for me because I am busy at work and only need to place entries once the EA sends confirmation. The position sizing class also helped me a lot because I can calculate the right trade size on the go."
Synthetics Pro ScannerVerified student
"The mentorship made the 4H CRT model clearer. I finally understood why patience, psychology, and defined risk matter before entering."
MentorshipVerified indicator user
"The free CRT chart has improved my trading by giving me clear entry and exit levels. It has also helped me cut losses early once a setup gets invalidated, and my PnL has started to grow for once in a long time."
Free CRT chart| Date | Symbol | Side | Entry | SL | TP | Result | Emotion | FOMO | Risk | Edit |
|---|---|---|---|---|---|---|---|---|---|---|
| No journal entries yet. | ||||||||||
Professional use and risk
Synthetics Hub helps traders learn free 4 hour Candle Range Theory setups using the website's CRT indicator. The goal is to identify structured signals across multiple synthetic indices, journal decisions, and practice execution with proper risk control.
Visitors can study 4H CRT ranges, FVG zones, liquidity sweeps, and signal levels directly on the website.
The free chart is built for structured CRT practice across Deriv volatility, Boom, and Crash markets.
The EA is presented from Synthetics Hub testing as an 80%+ model-tested scanner, but live results are not guaranteed.
The model is built around defined entry logic, stop-loss placement, and planned reward-to-risk.
Investment services
Availability is handled through WhatsApp confirmation before any onboarding.
For traders who want individual account management support. Pay a $100 onboarding fee, then send your MT5 login ID, server, and password on WhatsApp for confirmation.
Minimum account balance $300 Book SlotLimited slots. Availability must be confirmed on WhatsApp before joining.
Minimum $100 Confirm SlotCopy trading access for clients who prefer following managed trading activity.
Minimum $1,000 Book AccessMentorship
The mentorship is for traders who want to understand the structure behind the signals, not only receive alerts. It covers CRT, session-based trading, psychology, and practical execution so traders can eliminate market noise, wait for A-grade setups, and take trades with more discipline.
FAQs